The Explore Menu (Analysis Tools)
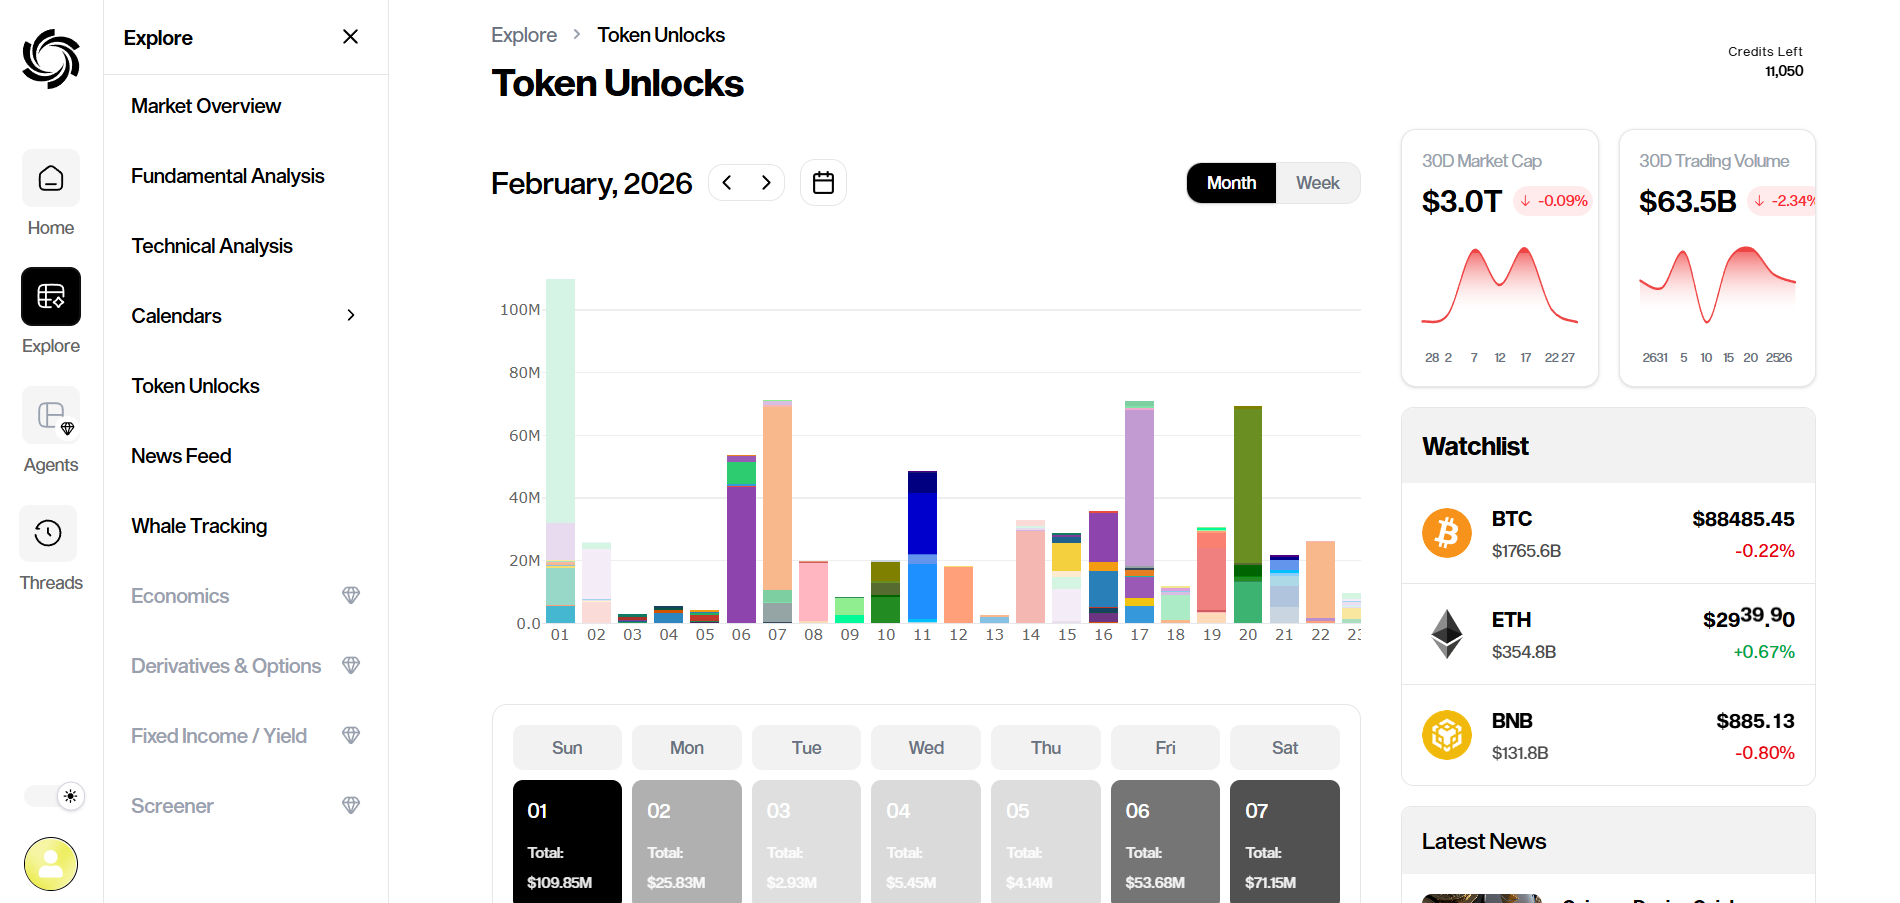
Clicking the Explore button on the left sidebar opens your main toolkit. This is where you go when you need to answer the question "Why?" in detail.
The Explore menu is broken down into specific sections, each designed to handle a different part of your research.
Market Overview
This is your high-level map.
The Chart: Shows you the global market cap, volume, Bitcoin dominance trends, and so much more.
The AI Narrative: This is the magic part. Below every chart, you will see an "AI Insights" box. Instead of just showing you a line going down, Eon reads the market data and explains why it’s happening (e.g., "Whale accumulation," "Sector rotation," or "Retail panic"). It turns raw data into a story.
Whale Tracking
You can’t control the market, but you can see who does. This tool tracks the "Smart Money."
AI Interpretation: We don't just list transactions. Our AI analyzes the volume and tells you if the activity indicates Accumulation (Bullish) or Distribution/Dumping (Bearish).
Exchange Pressure: Monitors the net flow of funds. Are whales moving money onto exchanges to sell, or off exchanges to hold?
Live Alerts: A real-time feed of massive on-chain movements (e.g., "500 BTC moved to Binance").
Fundamental & Technical Analysis
We automated the "grunt work" of research. You no longer need to visit 10 different websites to check a coin’s health.
Fundamental Analysis: Focuses on the "true value."
How to use: Select a token (e.g., BTC) → Select a metric (e.g., Circulating Supply vs Total Supply, Top Holder Concentration, or Dev Activity) → Click Get Analysis.
The Result: You get a clear written summary of the project's health.
Technical Analysis: Focuses on price action.
How to use: Select a token → Select an indicator (e.g., RSI, Moving Averages, or Auto Support/Resistance) → Click Get Analysis.
The Result: Eon tells you if the asset is overbought, oversold, or hitting a critical price wall. No need to draw lines on a chart yourself.
Calendars
Timing is everything. We split this into two views:
Event Calendar: Tracks crypto-specific events like Mainnet Launches, Governance Votes, and AMAs. These are potential catalysts for a price pump.
Economic Calendar: Tracks global macro events like CPI (Inflation) Data, Interest Rate Decisions, and GDP Reports. These affect the entire market (especially Bitcoin).
Token Unlocks
This tool is your shield against sudden price drops. It tracks when projects release locked tokens into the market (which often causes the price to dump).
Monthly View: The bar chart at the top shows you the "Danger Days" - dates with massive unlock volumes.
Daily Breakdown: Click on any specific day to see exactly which coins are unlocking and how much value (in millions of dollars) is hitting the market.
Why use it? Check this calendar before you buy. You don't want to buy a coin today if 10% of its supply unlocks tomorrow.
News Feed & Sentiment
Stop doom-scrolling.
Sentiment Analysis: We visualize the "mood" of the market using bar charts. You can see at a glance if the news for a specific coin is Positive (Bullish) or Negative (Bearish) over the last 7 days.
Smart Feed: Filter news by "Bullish" or "Bearish" to cut through the noise and see only what matters to your trade.
Now that you know how to analyze the market, let's look at how to manage your research.